How I forecast: stories from our all-time #1 Forecaster
Part 1: Question analysis
Editor’s note: Forecast is a new community for discussing the future, organized by topics that matter to people. Whether about news, politics, social issues, sports or pop culture, Forecasters work together to share their knowledge about what's going on today to build a better understanding of what will happen tomorrow. Download the app to join the community.
In this guest series, we welcome Joey Shurtleff, Forecast's all-time top Forecaster. In addition to being a top Forecaster with over 400 forecasts and 1 million points in reason supports to his name, Joey is also a serial entrepreneur and world traveler. Over the course of 3 posts, he'll be sharing some stories about making forecasts and winning the game.
I’ve been active on Forecast since early August, and I’ve enjoyed forecasting because I can exercise my probabilistic reasoning while also learning about new topics and current events. I’ve enjoyed the challenge of trying to discern between 50/50 and 70/30 outcomes, or between 80/20 and 90/10 outcomes… the probabilistic shades of gray that are typically glossed over in conversation but are very meaningful in life. I’ve also enjoyed trying to predict where a market will end up in the short-term and long-term, and I learn whenever my intuition leads me astray. Forecast is the only prediction market I’ve participated in, and I’ve continued to give it my time and attention because the app is well-built with good user engagement and interesting user-generated questions.
The Forecast team released the Forecast transaction data on November 4, and I spent several days in early November transforming and analyzing the data, with the goal of sharing insights that can help improve the quality of engagement on the app. The analysis that follows is of the “types” of bids I made and how each contributed to my point gains. I divided my forecast transactions into several forecast types, with some types divided further into subtypes. The pie chart below shows my estimated gains for each forecast type.
In this series of three posts, I will detail what each forecast type entails and highlight some examples of when each forecast type has gone well (as well as some examples of when things have gone poorly).
Part 1 (this one): Intro and analysis
Part 2: A finger on the pulse: News, external forecasts, and live data
Part 3: Exploits: Other (above board) ways to generate points
Along the way, I’ll also suggest a few product changes that I believe should be made to limit how lucrative certain forecast types can be; specifically, forecast types that are less about strong forecasting and more about a Forecaster’s speed to recognize a market opportunity that would be obvious to many others.
About Me
But first, a bit about me. I’m an entrepreneur, I studied economics and applied statistics in college, and my career has been spent in software engineering management, product management, software engineering, and data science and engineering. I also played poker semi-professionally for about a year, and I have several good friends who are successful professional gamblers.
I’m currently focused on solo early-stage research and development for my next entrepreneurial venture, which affords me an unusual amount of time flexibility that enables me to engage more intensely with Forecast than other Forecasters.
Analysis
The first forecast type I’ll focus on is “analysis”... what I consider to be “pure” forecasting. I gained over 125k points from this, representing over 15% of my total gains. I’ve divided this category into three types: strong-conviction analysis, weak-conviction analysis, and data analysis. Strong-conviction analysis represents 56% of gains earned from this type, data analysis 23% of gains earned from this type, and weak-conviction analysis makes up the rest.
My best strong-conviction analysis forecast was on this question:
I believed this to be highly unlikely for several reasons: Apple hadn’t used the phrase since 2017, Apple had been reserving the phrase for only the most important product launches since Steve Jobs’s passing, and there wasn’t a lot of compelling evidence to suggest that a major surprise product launch was going to happen at the October iPhone event. Nevertheless, there was plenty of market interest at around 25-40% on the Yes side: I ended up with 340 at-risk shares on the No side at an average cost of 64.4 pts per share, on which I gained over 14,000 pts.
Another lucrative strong-conviction analysis forecast was across multiple questions pertaining to Amy Coney Barrett’s nomination to the Supreme Court. Some Forecasters thought that the Republicans might shy away from pursuing the nomination, or shy away from pursuing it before the election, or that the several COVID-19 cases in the Senate might derail the process. I was confident that nothing would stop the nomination from going through, and I gained over 13,000 points from roughly 700 shares in positions across 7 related questions.
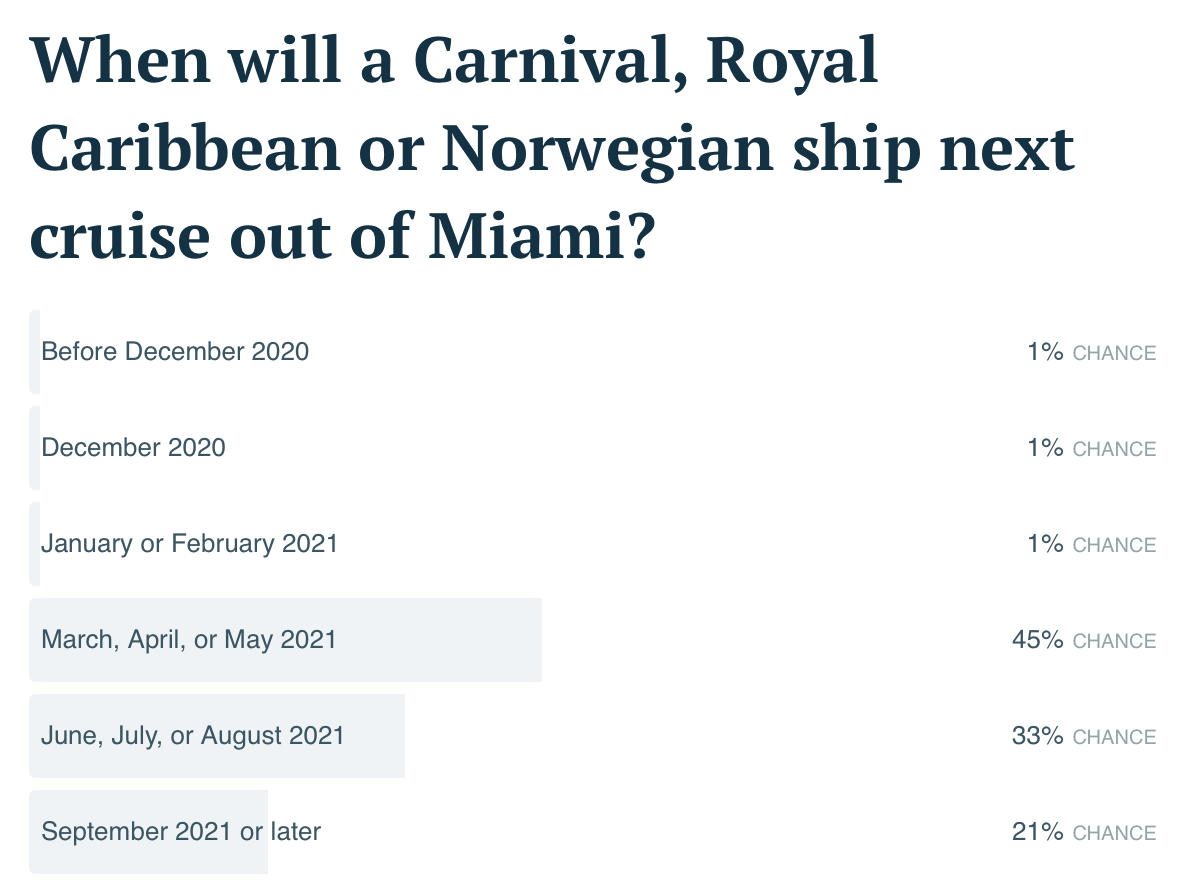
I’ve largely managed to avoid major losses on my strong- and weak-conviction forecasts. My worst-performing of these was this one, which is still open:
The CDC lifted its cruise ship ban in October due to pressure from the Trump administration and industry groups, and I correctly figured that weak demand would contribute to November cruises being cancelled. What I didn’t count on was December cruises being cancelled as well, due to an industry-unfriendly requirement for a “Conditional Sailing Certificate” that must be applied for at least 60 days before setting sail. I lost just over 1,100 pts on this misstep.
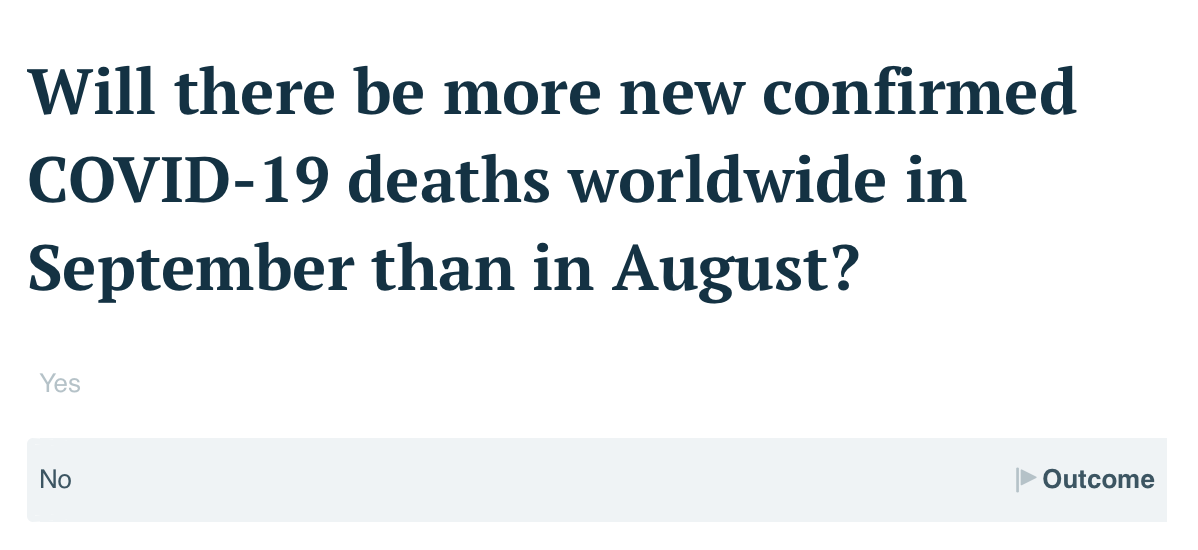
My biggest analysis winner, and biggest losers, came from data analysis. My best outcome was on this question:
I had been tracking the COVID-19 cases and deaths for a while (for reasons unrelated to Forecast) and I noticed that deaths in many of the hardest hit countries were plateauing or declining in August, and that deaths were declining earlier and faster than cases were. Based on this, I initially took a fairly large position on the No side of this question, and in the related question about COVID-19 cases instead of deaths.
Soon thereafter, I decided to run some numbers to validate my hunch and I put together a quick-and-dirty logistic regression spreadsheet. It turned out that cases looked like they would keep increasing in September but deaths looked to keep declining, so I exited my position on the “cases” question at a loss of ~2,150 pts and continued to build a large contrarian position on the “deaths” question. I ended up with 475 shares, and a gain of over 17,000 pts on that question.
My biggest loser was on the same question the next month. Logistic regression initially suggested that it was possible that the deaths could also be lower in October than they were in September. However, the start of the Autumn wave in Europe and North America led to this question being much less close than I thought it could be, and I took a loss of just under 5,000 pts net.
I hope these anecdotes have been interesting and informative! My biggest takeaway from this section is that I should double and triple check the validity of my hunches, then load up on shares (at the best possible price) when I have high conviction that I understand something that other Forecasters are missing. Stay tuned next week for Part II: A finger on the pulse: News, external forecasts, and live data.


