
Who's Best at Predicting the Future?
Part 1: Why Brier Score Fails

Editor’s note: Forecast is a social prediction market: an exchange where participants use points to trade on the likelihood of future events. Community members pose questions about the future, make predictions, and contribute to discussions leveraging their collective knowledge. Download the app to join the community.
This is the first post in a two-part series about measuring user’s forecasting accuracy in prediction markets. You can find all the data the data used to generate this analysis in the public Forecast Data Stream.
What does it mean to be good at forecasting? In theory, this is a simple question: you make some predictions, you get them right, boom: you’re a good forecaster.
But hold on a second…
Is it more ‘impressive’ to predict a question with a binary outcome compared to one with 7 possible choices? What about question difficulty? It is, for example, a lot easier to predict who will lead the senate majority in 2021 today compared with a month ago. Forecast’s prediction market mechanic adds additional difficulty. Is someone who ‘bought low’ on the ultimate outcome a better forecaster compared to someone who got in once the market had reached a higher price? And what does it mean if you sold your ultimately incorrect position at a profit before the question resolved?
These are a few of the challenges in determining individual users’ forecasting accuracy. In this post, we’ll tell you about classical error metrics like Brier score, and why they don’t work so well for prediction markets. In the next post in this series, we’ll discuss the tradeoffs of several alternative accuracy measures we’ve developed--and what we’re using today.
First, a brief refresher:
How you win in Forecast
There are two skill trees you can level up to earn more points on Forecast: Forecasting skill and Trading skill. We think of Forecasting skill as the ability to generate reasonably accurate predictions of probability, while Trading skill is the ability to earn more than would have been earned with a simple buy and hold strategy through efficient resource deployment. Think about it this way: it takes research and knowledge to write an insightful reason like Sonia’s below (and here)--that’s Forecasting skill. It takes careful monitoring of the overall market to know when to sell a position that has reached diminishing returns (for example, one in which your position is now priced at 95 or greater) to reinvest points gained elsewhere--that’s Trading skill.

Some amount of Forecasting skill is required to be successful on the app. Our analysis to date suggests that most successful Forecasters have shown an aptitude for both.
In the forecast leaderboard, both skills are flattened into a single scoring system: profit. Metrics like profits earned per time period (e.g., % return on invested capital per year) are great when the goal is to maximize return (perhaps with minimal variance) and, as an added benefit, they make for a pretty fun game. The problem with profit from an accuracy measurement perspective is that it provides no insight into how the user achieved success. For that, we need something different.
How is forecasting accuracy traditionally measured
As anyone familiar with the rise of artificial intelligence will tell you, there are many ways to measure how good a person or machine is at forecasting a given outcome (whether it’s a world event, what product a user is most likely to click on in an ad, or whether a blob of pixels in a video stream is a person or a stop light). This is because, when people talk about predictive accuracy in a casual sense, they’re really talking about multiple related concepts.
In Forecast’s world, your accuracy is the number of times you got a forecast right over the number of forecasts you made; your precision is how many times you correctly predicted Yes over the total number of Yeses you predicted; your recall is the number of times you correctly predicted Yes over the number of questions you forecasted that settled Yes. Related concepts, but all of them measure slightly different things.
It doesn’t end there. Some metrics, like F-score give more weight to false positives and false negatives, whereas others, like area under curve measure accuracy as an integral of predicted performance in a two-dimensional space.
One of the most important classical metrics in the event outcome forecasting world is the Brier score. Brier is a way of comparing accuracy between different sets of forecasts where the makers assign probabilities rather than binary outcomes. Sounds exactly like Forecast, right?? Well...
What’s wrong with the Brier score?
Our first thought when designing a user forecasting skill metric was indeed to consider traditional model accuracy metrics by using Buy price as the predicted probability. We’ve been using Brier Score to understand the accuracy of questions, topics, and our market overall and it works well for that purpose because the market price is the contract-weighted implied probability.
However, we soon realized these metrics don’t work for measuring user skill because Forecast doesn’t capture your predicted probability of an outcome - we only know your minimum predicted probability of the outcome. When you Buy the Yes for 25 points, we don’t know if you believe the probability is 30% or 90%, just that it’s greater than 25%.
In stock market language, Forecast only (currently) allows users to make market orders, but not limit orders. While other prediction markets like PredictIt do allow limit orders, this doesn’t really solve the problem because the execution of any given order is predicated on someone being willing to buy the other side. If you want to buy Yes for 90 points, but someone is only willing to sell it to you for 80 points, we still don’t get a grasp of your true predicted probability from looking at your actual trades, because we don’t know what you would have been willing to pay.
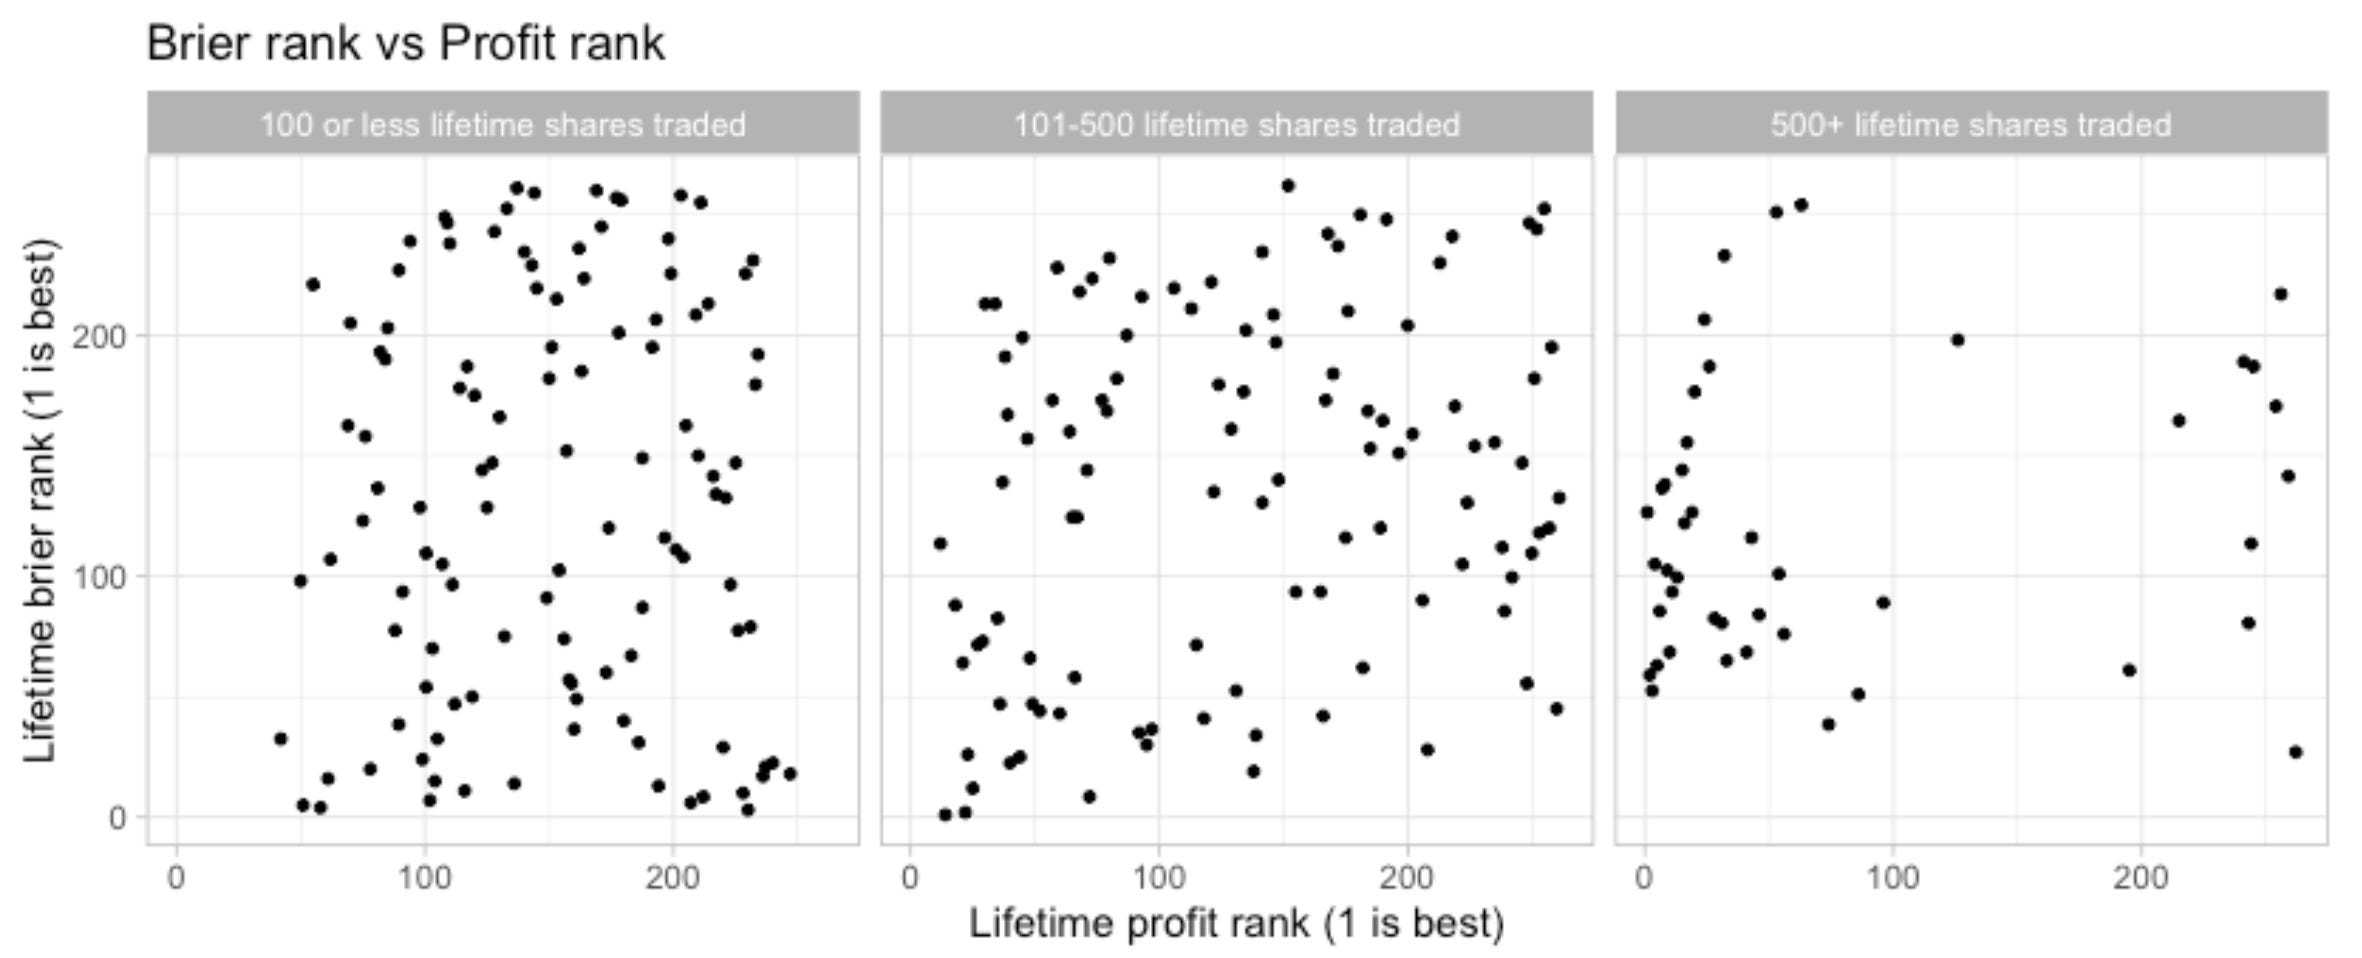
When we plot lifetime Brier score on closed questions against a ranking of users by lifetime profit (called ‘lifetime profit rank’ above) we see that there is little relationship between the two. The reason becomes clear when we consider a typical scenario:
User A Buys the Yes for 40 points
User B Buys the Yes for 60 points
The outcome occurs
It’s intuitive that user A displayed more forecasting skill because they bought the correct position when the market was less certain that the event would occur. However, setting out to minimize a classic error metric such as Brier will penalize user A because their prediction is “farther” from the outcome if we treat their buying price as their predicted probability (40 points → 40%) and the outcome as the correct value (event occurs = 100 points → 100%):
User A brier “error” = (0.4 - 1)^2 = 0.36
User B brier “error” = (0.6 - 1)^2 = 0.16
User B has lower “error” but they clearly displayed less skill
So now what?
Stay tuned for part 2, where we’ll discuss the tradeoffs between several alternative metrics we’ve developed and why we chose a metric we’re calling Advantage.
One more note: the data used to generate this analysis is available in the public Forecast Data Stream, which we’ve made available for forecasters, researchers, and anyone else interested in analyzing the Forecast community’s growing list of questions, forecasts and reasons. We’d love feedback so please download the data and tell us what you think!